The
Veterinary Genetics Laboratory of UC Davis has forwarded the HWSD
test results covering 23 October 2014 to 4 March 2015.
Using the
raw data supplied by VGL the CPRG makes the following report.
Sadly the
momentum of the first 6 weeks of testing has not been maintained. In
the first flush of the test being available, 400 ponies were tested.
In the six months following, the number has dropped to 264 ponies
tested.
It is now
quite obvious and incontrovertible that the countries producing the
largest number of ponies are the poorest performers with regards to
HWSD testing of ponies.
The fall
off in testing is demonstrated by the following chart:
The two
comparative charts demonstrates the country variables.
Please
note that changes in scale occur relative to the data range in each
individual chart.
This means that one cannot just
compare the 'visual pattern' between one chart and the next.
A
secondary issue requiring clarification is the reporting rate of test
results. This varies from country to country
It is
quite obvious that there are more ponies being tested than for which
any information is being publicly listed by the owners. Of course
there is a fundamental right of privacy for pony owners.
Below is a
an overall view of reporting rates. The reporting rate is
established by comparing the number of ponies listed on the CPRG
tested ponies page, to the number of ponies tested
at VGL.
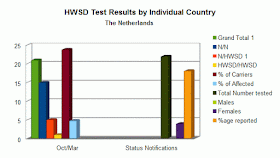
So the total number ponies tested is over six hundred. Across all the countries the reporting level is 53% of ponies tested with the median slightly higher.
Each country is then charted and shows the testing statistics for the period September 2014 to 4 March 2015 as two separate cohorts. Status notification equates to reporting rates as previously explained.
With only
three ponies tested in France it is very easy to get 100% reporting!!
Conclusion:
What this data illustrates is that the uptake of HWSD testing of breeding stock is far lower than what is required for the ongoing safety of the breed. Some countries have been much more proactive in testing for HWSD. These countries are also the ones which, on a numerical basis have to be considered to be 'minority' populations.
The 'big three', Ireland, France and the UK have really abysmal testing rates; both individual breeders and the breed societies in these countries, really need to have a good hard look at themselves and their motivations as to why they are not testing.
Until there is a larger population of ponies tested, the carrier population does remain 'biased'. However even with the limited information already available, between the two tested cohorts for which there is information, the drop in the carrier level is only minimal.
This is a concern.
The majority of the test results being reported are for N/N ponies. Only one country, New Zealand, has reported all of the tested carrier ponies.
It is very obvious that the reporting of carrier or affected status ponies is at a rate very much lower than the actual number being tested.
The raw data is as follows:
| HWSD DNA Testing Statistics - 10/23/2014 - 03/04/2015 | ||||
| By Country | N/N | N/HWSD | HWSD/HWSD | Grand Total |
| Australia | 29 | 4 | 33 | |
| Canada | 7 | 2 | 9 | |
| Germany | 14 | 4 | 18 | |
| Denmark | 8 | 2 | 10 | |
| Finland | 12 | 7 | 19 | |
| France | 1 | 1 | ||
| Great Britain | 21 | 10 | 1 | 32 |
| Ireland | 25 | 5 | 30 | |
| The Netherlands | 15 | 5 | 1 | 21 |
| New Zealand | 2 | 2 | ||
| Sweden | 25 | 14 | 1 | 40 |
| United States | 39 | 9 | 1 | 49 |
| Grand Total | 198 | 62 | 4 | 264 |


